PRODUCT DESIGN
Ratatapp
Overview
This case presents the final project of the Specialization in Interaction Design course at FATEC Senac Rio, called "Ratatapp". The main stages of the project, the processes and techniques used during development and the impact of each on the project's progress will be explained here.
My Role
Product Designer, Interaction Designer, UI/UX Designer
Period
2016 – 2018
Understanding the Problem
The initial problem that motivated the creation of the "Ratatapp" platform involved a perception that in recent years, people have lost more and more contact in live meetings, prioritizing maintaining contact through social networks and messaging apps. Although these tools provide great facilities and make a decisive contribution to maintaining social ties, I understood that live meetings still had very specific characteristics that I consider crucial to strengthening social bonds. The book "Alone Together" by American sociologist Sherry Turkle served as a basis for reinforcing this thesis, since it deals precisely with the idea that through networks, we are literally "alone together".
The challenge
The main challenge of this project was to understand how technology, through apps, platforms and digital experiences, could contribute to strengthening live social ties, which can be considered a paradox, since the ideal would be to find a way of using technology to disconnect from it for longer, so that people could devote more time to each other.
Ideation
Considering the problem presented, ideation was an important moment to understand how technology could help promote more social encounters in person, which Initially, the concept of "Ratatapp" was proposed to be a digital platform for managing supermarket transactions. It was intended to be a multi-platform software. Ratatapp can also be used to manage household supplies, or even supplies for small social events, in a collaborative and interactive approach.
During certain stages of the research, some results brought to light enough relevant information for the scope of the project to change reasonably, becoming a mobile application aimed at managing social events, with supply management being just one part of what the project would cover.
Although this work presents the research and investigation stages separately, they took place simultaneously and iteratively, and are presented in sequence only to facilitate understanding.
Social event management app.
The difficulty people face in meeting physically (friends, family, etc.). People don't see each other as often as they would like because of difficulties such as reconciling schedules, financial difficulties, among other factors.
A tool that helps you cross-reference and combine people's availability and helps you keep track of the costs of an event will help you get people to meet physically more often.
Facilitate the conditions for people to meet physically more often.
Collaborate so that people have information about what has worked in the history of events, so that they can maintain the conditions that favored the meetings.
Social groups of different kinds (groups of friends, family, work colleagues, band etc).
People always say they don't have time (or money) to go out and see each other.
Project Management

Vision Canvas
This technique was designed to assist in identifying the project's basic requirements. The following topics were investigated and listed in this canva: "pain", objectives, benefits, products that would be delivered, main items in the backlog, definitions of who the user is, other parts involved in the process, technical issues and limitations, and project graphical interface characteristics. The descriptive memorandum contains a more in-depth analysis of the test.

Business Model Canvas
The Business Model Canvas is a diagram illustrating the major components that compose a company's structure. It can also be a strategy formula, with quadrants that must be regularly assessed over time to determine if each one is being attended to properly, or if adjustments to any of them are required to achieve a better result. The map summarizes the important features of a business plan, but it is not a business plan in and of itself because it is a less formal tool that can even be utilized on a daily basis.

Project Model Canvas
The Project Model Canvas seeks to enable co-creation of the project plan through the engagement and participation of the key stakeholders. The technique aids in the creation of a macro project plan, the outcome of which will assist the P.O. (Product Owner or project manager) and his team in better detailing it. The template is separated into five blocks that answer five basic questions: "Why?", "What?", "Who?", "How?", and "When and How Much?"
Research Phase
Focus Group
The technique had the participation of 5 people, aged between 27 and 34 years, and had the following questions as a guide:
- How frequently do you go shopping?
- How do you plan your shopping?
- How many people live in your house, including you?
- How long do you spend shopping on average?
- What problems do you usually face when shopping?
- What would help you improve your shopping experience?

Record of the focus group
Results and conclusion
What could be concluded from this focus group is that the way people shop nowadays has changed a lot compared to what was done in the past. Nowadays, with all the speed at which information circulates and the dynamism with which we do things, people no longer have the time, or even the inclination, to set aside a moment in their routine to go to the supermarket, which makes the whole shopping experience increasingly punctual and objective
Within what the platform in question would set out to do, few tools would actively contribute to improving the participants' shopping experience, since one of the project's main hypotheses (people want to pay less for the product they consume) was not confirmed, since "high prices" was not one of the pains that appeared in the analysis of the focus group responses.
This result already served to raise alarm bells about the possible functionalities and even the purpose of the platform that was being proposed, and the quantitative research carried out in the next stage confirmed these ideas.
Quantitative research
The aim of this stage of the survey was to find out more about the behavior of the platform's target audience. The platform used to carry out the questionnaire was Google Form. The sample in the first version of the questionnaire was 111 responses, and this questionnaire was mainly concerned with the behavior of users when shopping in the market.
As the project's focus changed along the way (when the application's objective changed from managing market purchases to managing social events), a new questionnaire had to be applied, with questions adjusted to the new topic. A more in-depth look at the results of this stage of the research can be found in the project description.
Personas

Sabrina, the university student
Psychologist, 27 years old
Social media: Facebook, Pinterest.
Objectives: Financial and professional stability to move out of your parents' house.
Challenges: Now in the final stretch of college, because she spends most of her time studying and working, she tends to have little time for herself and to see her friends. She would like to find ways to optimize her time and have more contact with loved ones, as she understands how important this is for her mental health.
App Value The app can help you organize events so you can see your friends more often.

Flavio, the university student
Trainee, 23 years old
Social media: Instagram, Twitter.
Objectives: Develop the ability to organize events professionally.
Challenges: A university student, Flávio values socializing through events, and is always looking for the best ways to organize gatherings at his university (focusing on the best cost-benefit ratio, as many university students don't work). He wants to hold them year after year, but he can't maintain the standard of quality from one event to the next.
App Value The application gathers a history of past events and can store information to help you organize future events.

Regina, the housewife
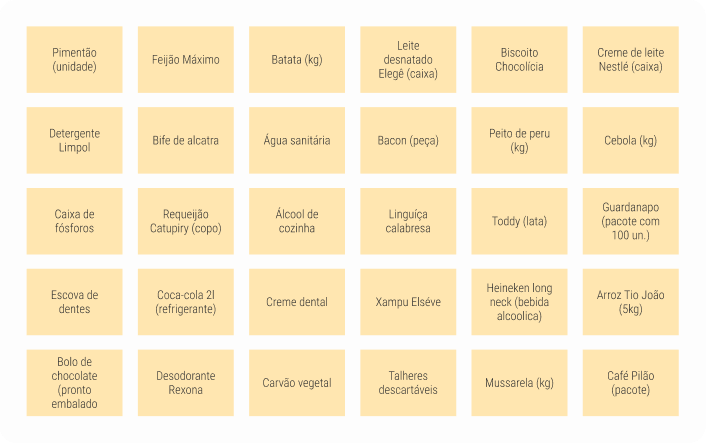
University teacher, 44 years old
Social media: Linkedin, Pinterest, Facebook.
Objectives: Keeping in touch with friends from my university days, even with the difficulties of finding time for all of them.
Challenges: Her busy routine makes it increasingly difficult to meet up with friends or family, and financial difficulties also get in the way, as a teacher's salary isn't very high.
App Value In the app, you can cross-reference the schedules of family members and friends, combining their availability and helping to set up meetings. You can also estimate the budget for the event.
Empathy Map

User's Journey

Architecture and Navigation Flows

Card Sorting
Card sorting is a technique used to check whether the architecture of websites and other platforms makes sense from the users' point of view. The Ratatapp project had two phases, and the technique was applied in the first. Its purpose was to understand how certain products on a shopping list would be mapped. Even after the project's focus changed, the technique contributed to the construction of subsequent systems.
Navigation Flow

First wireframes

Sitemap

First Prototypes and Visual Identity
Low-fidelity prototype
During the research stages, the first navigable prototypes of the platform were created. The first low-fidelity layout was created using the Axure 6 tool, and its screens can be seen below:

Definitions of Visual Identity
Once the first low-fidelity screens had been developed, the elements of the visual identity began to be defined. At this stage, the fonts that would be used throughout the project, the brand and the color palette were defined. It was also during this stage that the naming process was carried out, where the name Ratatapp was chosen. Below are the elements and processes that were part of this stage.
Brand
Two brands were used throughout the project. The first (opposite, left) was applied to the screens of the high-fidelity prototype, but this version was altered due to flaws in its readability. Subsequently, a new brand (opposite, right) was adopted after a redesign. This was the version used until the end of this project.

Typographic families
Below, I list the three typefaces selected for the project, with explanations of how each one will be used.
Used for short, more prominent messages. It is the original font for the Ratatapp logo.
Usada para mensagens curtas e de maior destaque. É a fonte original do logotipo da Ratatapp.
Main source for app documentation and reports. It is the system font used for presentations and other offline pieces
Moodboard

Color Palette

RGB: 42 / 140 / 191
CMYK: 93 / 35 / 20 / 0
HEX: 2A8CBF
Pantone: 7704 C

RGB: 74/ 215 / 204
CMYK: 85 / 0 / 45 / 0
HEX: 4AD7CC
Pantone: 3265 C

RGB: 123 / 188 / 104
CMYK: 68 / 18 / 94 / 0
HEX: 7DBC68
Pantone: 7737 C

RGB: 254 / 192 / 57
CMYK: 1 / 29 / 82 / 0
HEX: FEC039
Pantone: 1225 C

RGB: 41 / 47 / 139
CMYK: 95 / 93 / 0 / 0
HEX: 292F8B
Pantone: 2736 C

RGB: 42 / 140 / 191
CMYK: 93 / 35 / 20 / 0
HEX: 2A8CBF
Pantone: 7704 C
RGB: 74 / 215 / 204
CMYK: 85 / 0 / 45 / 0
HEX: 4AD7CC
Pantone: 3265 C

RGB: 123 / 188 / 104
CMYK: 68 / 18 / 94 / 0
HEX: 7DBC68
Pantone: 7737 C
RGB: 254 / 192 / 57
CMYK: 1 / 29 / 82 / 0
HEX: FEC039
Pantone: 1225 C

RGB: 41 / 47 / 139
CMYK: 95 / 93 / 0 / 0
HEX: 292F8B
Pantone: 2736 C
High Fidelity Prototype - Version 1
As the visual identity definitions progressed, the first screens of the high-fidelity prototype began to emerge. Below are some of the screens developed at this stage. With the screens in high definition, it was possible to move on to the next step, which was usability testing.

Usability Testing
Heuristic Evaluation
Heuristic Evaluation aims to find usability problems in an interface quickly and cheaply. In it, evaluators (in this case, usability experts) investigate a system with interfaces and judge their efficiency based on heuristics referring to usability principles. The most famous heuristics are those of Nielsen and Molich (1990), for web interfaces, but for this project, the heuristics described by Inostroza (2012) were used, specifically for touchscreen mobile devices. Below is a list of the heuristics in question.
- Visibility and system status
- Relationship between system and real world
- User freedom and control
- Consistency and standardization
- Error prevention
- Recognition rather than memorization
- Flexibility and efficiency of use
- Efficiency of use and performance
- Aesthetic and minimalist design
- Help users recognize and recover errors
- Help and documentation
- Physical interaction and ergonomics
Application and Results
The heuristic evaluation was carried out with 3 UX experts and was based on the Inostroza heuristics mentioned above. Below is an example of the table with the main results of the 3 combined evaluations. The proposal was to survey the problems identified in the prototype and classify each occurrence according to the corresponding heuristics, as well as a pre-established degree of severity:
- Severity 1: a simple problem, usually associated with aesthetics;
- Severity 2: is already a more serious problem, although it's not something that drastically affects usability;
- Severity 3: indicates a serious problem, which should be analyzed as soon as possible because it affects usability;
- Severity 4: classifies an urgent problem, which needs to be solved immediately because it is considered an obstacle that prevents the user from using the system properly.

High Fidelity Prototype in Figma
Results and Conclusion
The project was completed in 2018, at the end of the Specialization course in Interaction Design, and was approved with a maximum concept. The development of the proposed solution provided several insights into user behavior and the different paths a project can take according to the results revealed by the research. In addition to the final presentation to the board, the project also generated a document of more than 160 pages, containing all the stages in the development of the project solution in an extremely detailed manner.
The analysis of the impact that each technique had during the course of the project, as well as the opportunity to use a heuristic evaluation of cell phone usability by Inostroza (2012), and the chance to observe the results of the application of this usability test in conjunction with the cooperative evaluation led to the production of a scientific article. This was written in partnership with my advisor throughout the project, Adriano Renzi, PhD in design (DSc.), and was accepted and presented at the 10º Applied Human Factors and Ergonomics (AHFE), international congress on design and ergonomics that took place in Washington D.C., USA, in July 2019. It was the first time I had the chance to present a paper at a congress, and the fact that it was at an international event made it a special and extremely enriching experience, as well as the opportunity to network with great professionals.

My participation in AHFE 2019